
01 · Team Lead
Lansah
Owns ingestion, schemas, and reproducibility. Makes sure every score can be traced back to a row of source data.
● SAPTA · v0.1 · field-ready heuristic
SAPTA scores rural pit latrines on groundwater-contamination risk and dispatches vacuum trucks under real capacity limits. Built for WASH teams in climate-stressed regions.
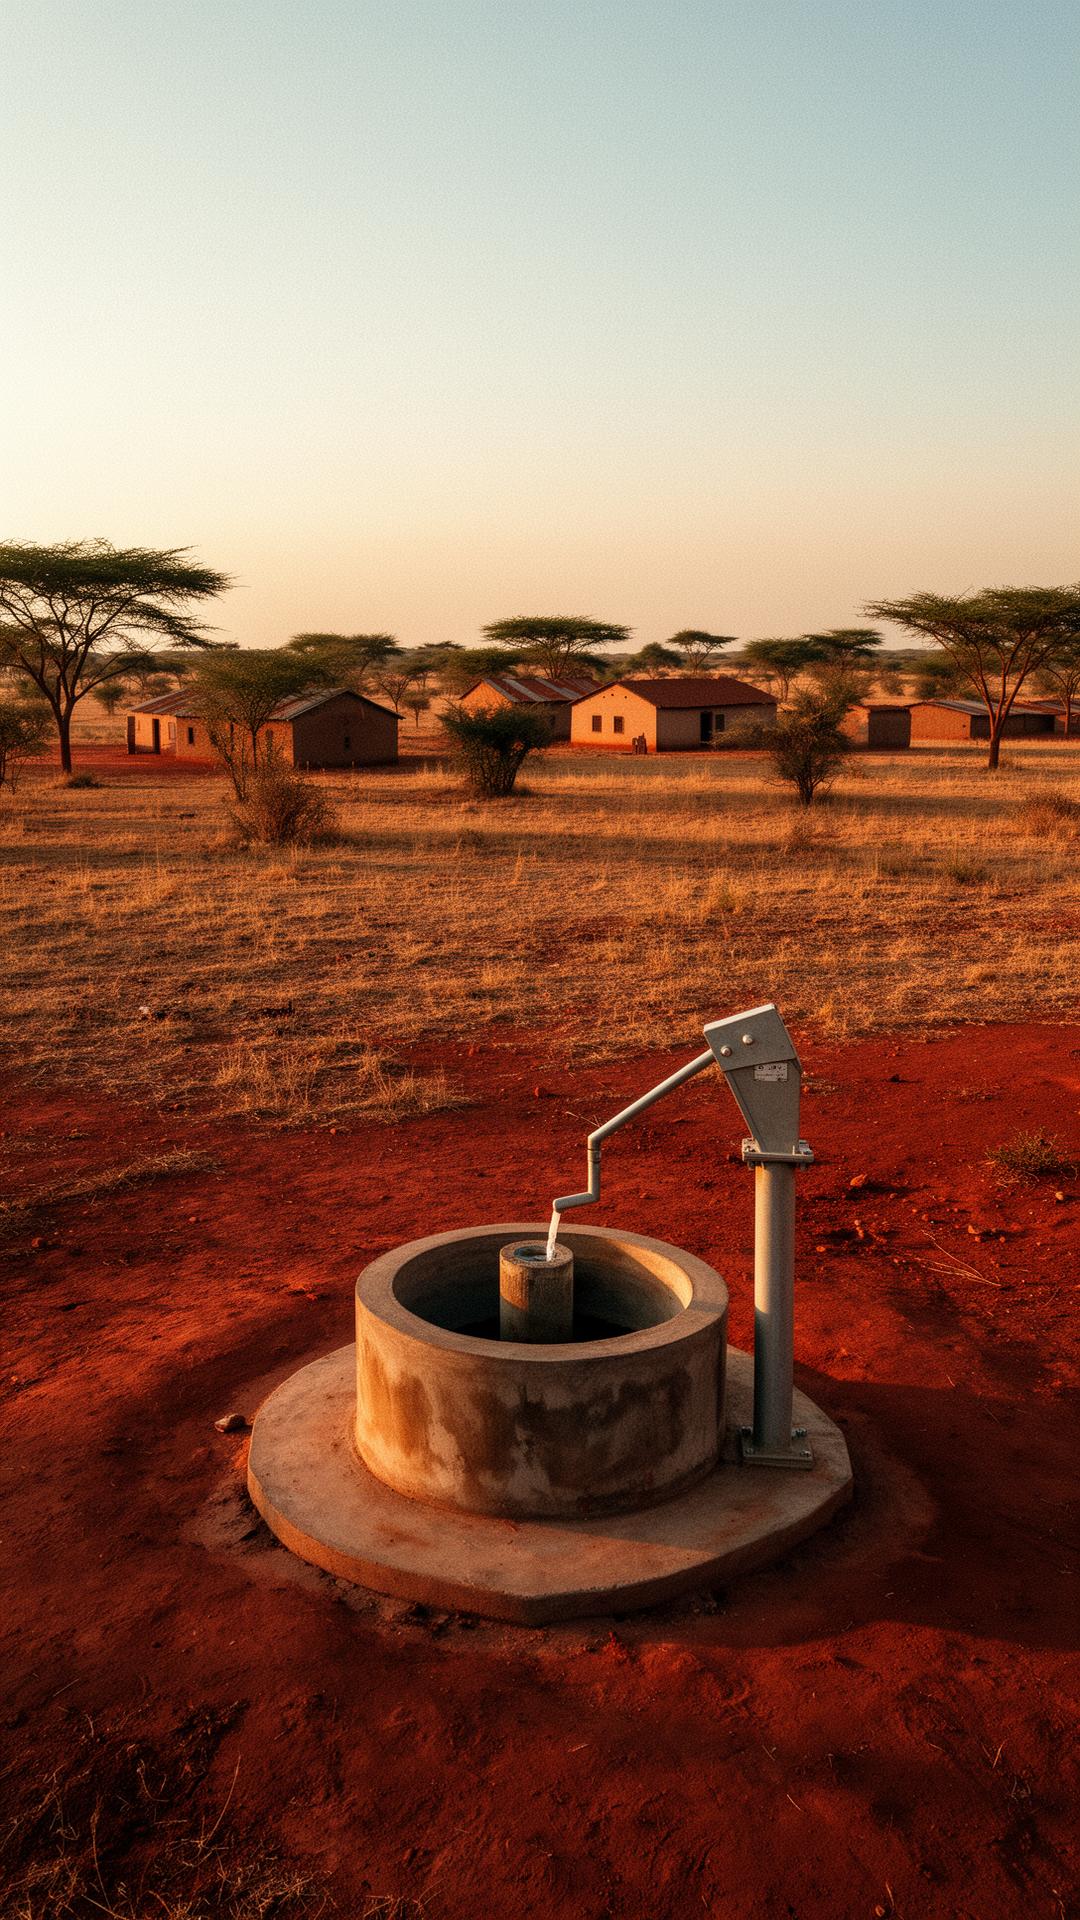
Upper East Region · synthetic dataset v0.1
The problem
“A single contaminated well can sicken a village faster than any truck can reach it.”
Pit latrines sit meters from hand-pump wells. Pathogens migrate through sandy vadose soils long before anyone notices a foul taste.
A single 40 mm event can raise the water table and flush latrine contents toward the nearest aquifer overnight.
WASH teams have a handful of vacuum trucks for an entire district. Routing is done from memory, phone calls, and gut feel.
Vacuum trucks can service ≈ 10 pits / 48h. A district has hundreds.
The solution
One number per pit. Deterministic, explainable, and tuned by people who have walked the routes.
Fill level, rainfall forecasts, soil class, distance to nearest well, pit condition.
Deterministic, auditable scoring function. Six weighted factors collapsed to a single risk index per pit.
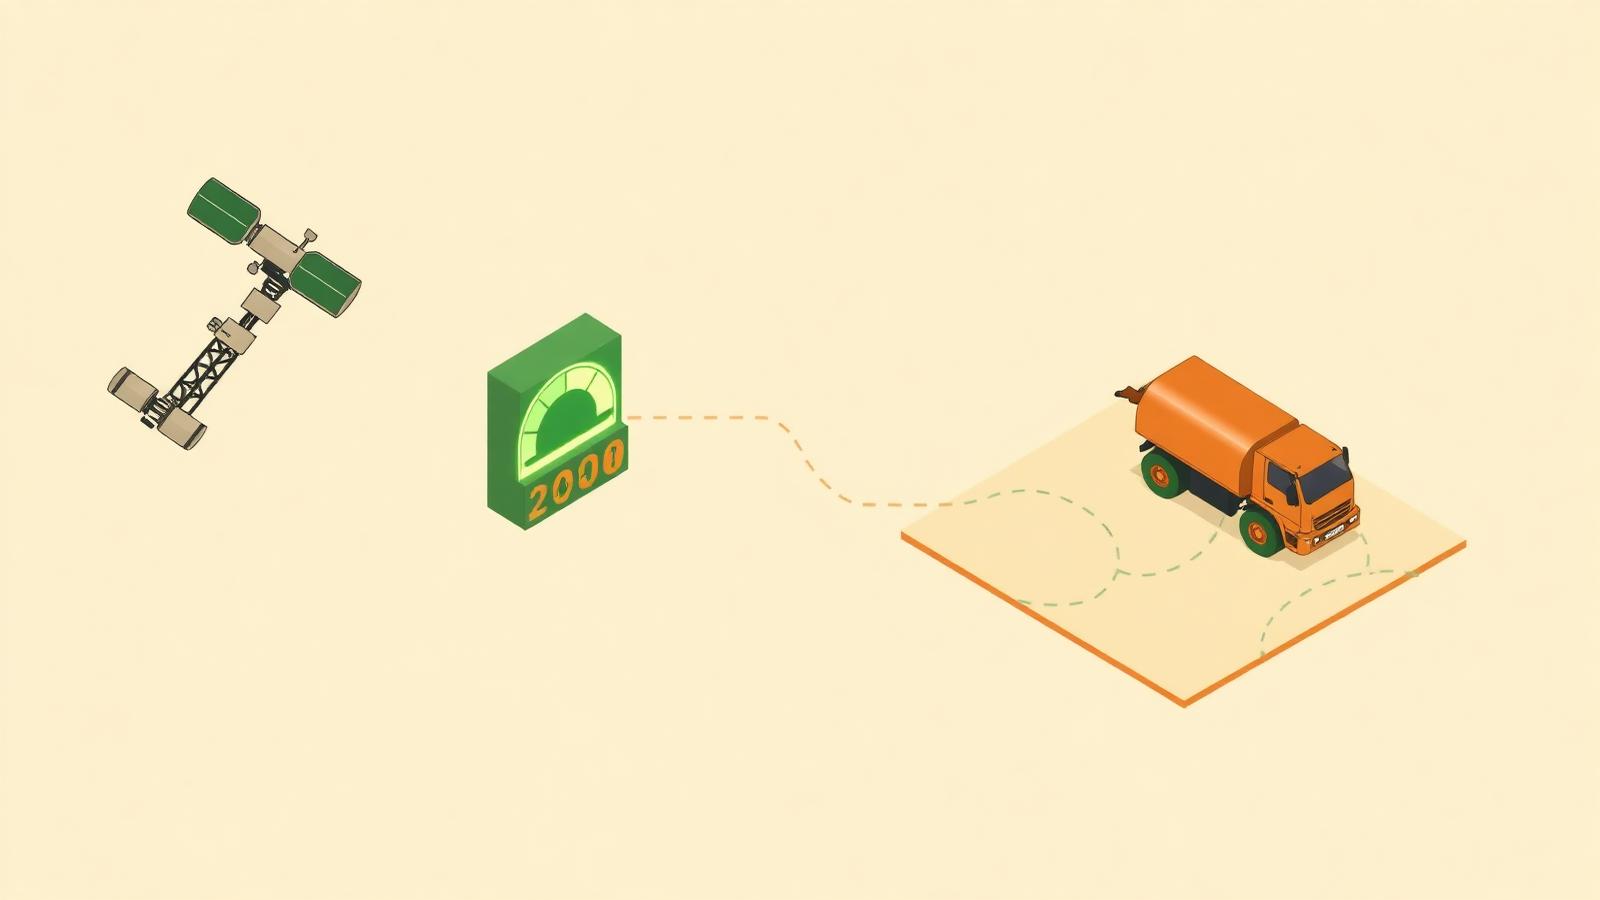
Capacity-aware selection of top-N pits within the 48h service window, with truck distance constraints.
Fill level, rainfall forecasts, soil class, distance to nearest well, pit condition.
Deterministic, auditable scoring function. Six weighted factors collapsed to a single risk index per pit.
Capacity-aware selection of top-N pits within the 48h service window, with truck distance constraints.
How it works
Each pit is reduced to a single value between 0 and 1. The dispatch engine reads only this number — but every number is traceable to its inputs.
Note · v0.1
v0.1 is a calibrated heuristic — auditable, deterministic, hackathon-honest. v0.2 learns weights from labeled overflow events.
Live demo
The pipeline produces two artifacts a district WASH officer can actually open: priorities.csv ranked by risk, and an interactive map.html with the dispatch route already drawn.
No cloud login. No PowerBI license. Open the file, print the route, drive the truck.
Run it yourself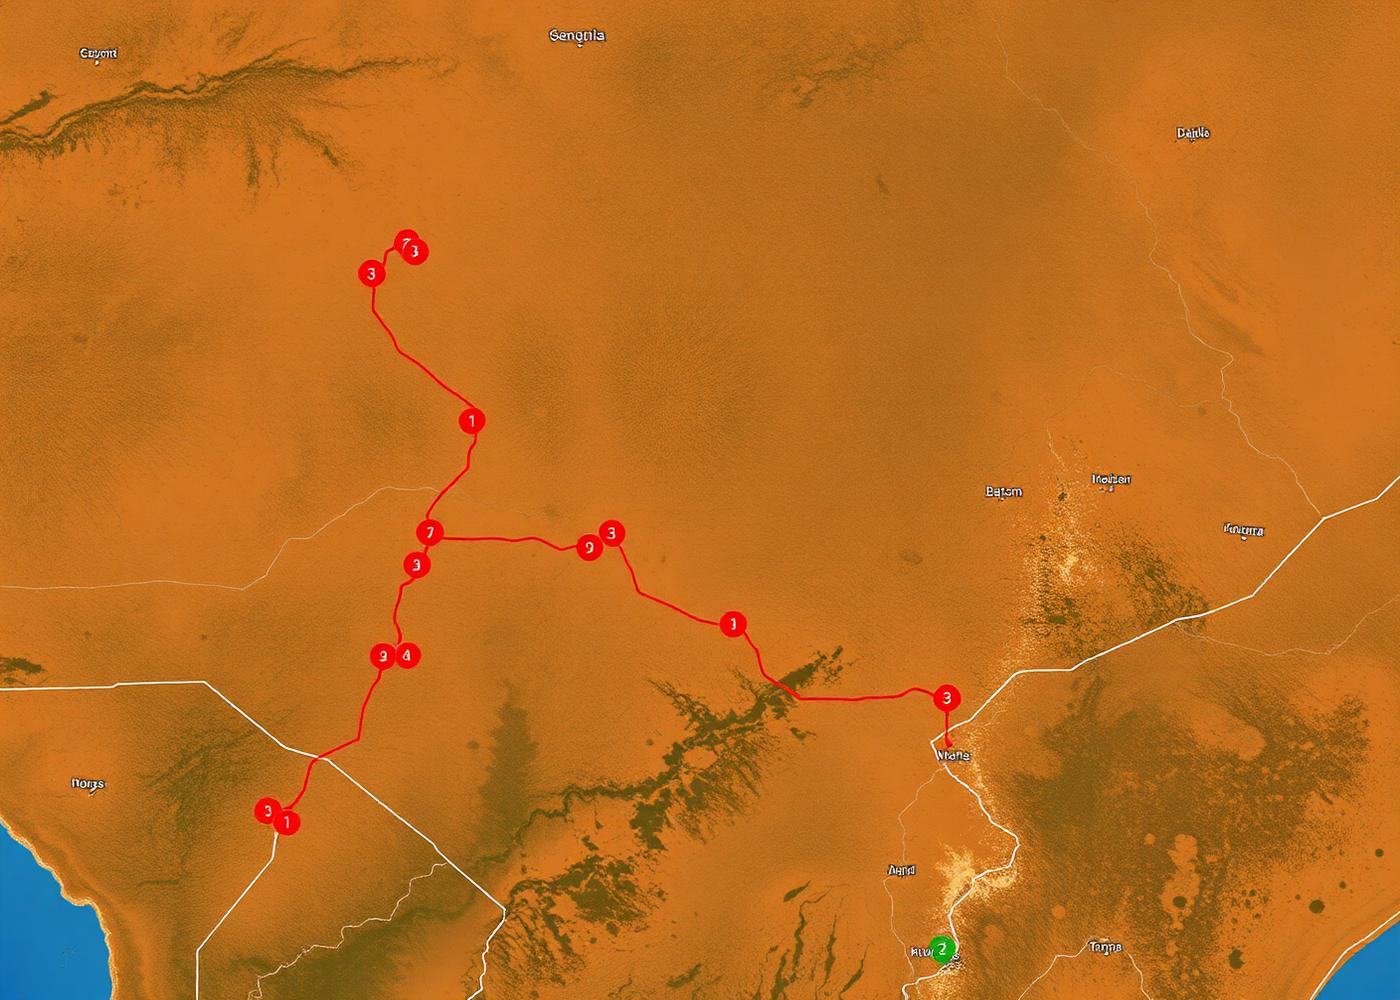
$ python -m sapta.run --config config/upper_east.yaml
[load]   pits=30  wells=12  rainfall=48h
[score]  SaniFlowCore  min=0.11  max=0.87
[dispatch] capacity=10 window=48h  selected=10
[write]  priorities.csv  map.html
✓ SAPTA pipeline complete in 2.4s.
The IoT layer
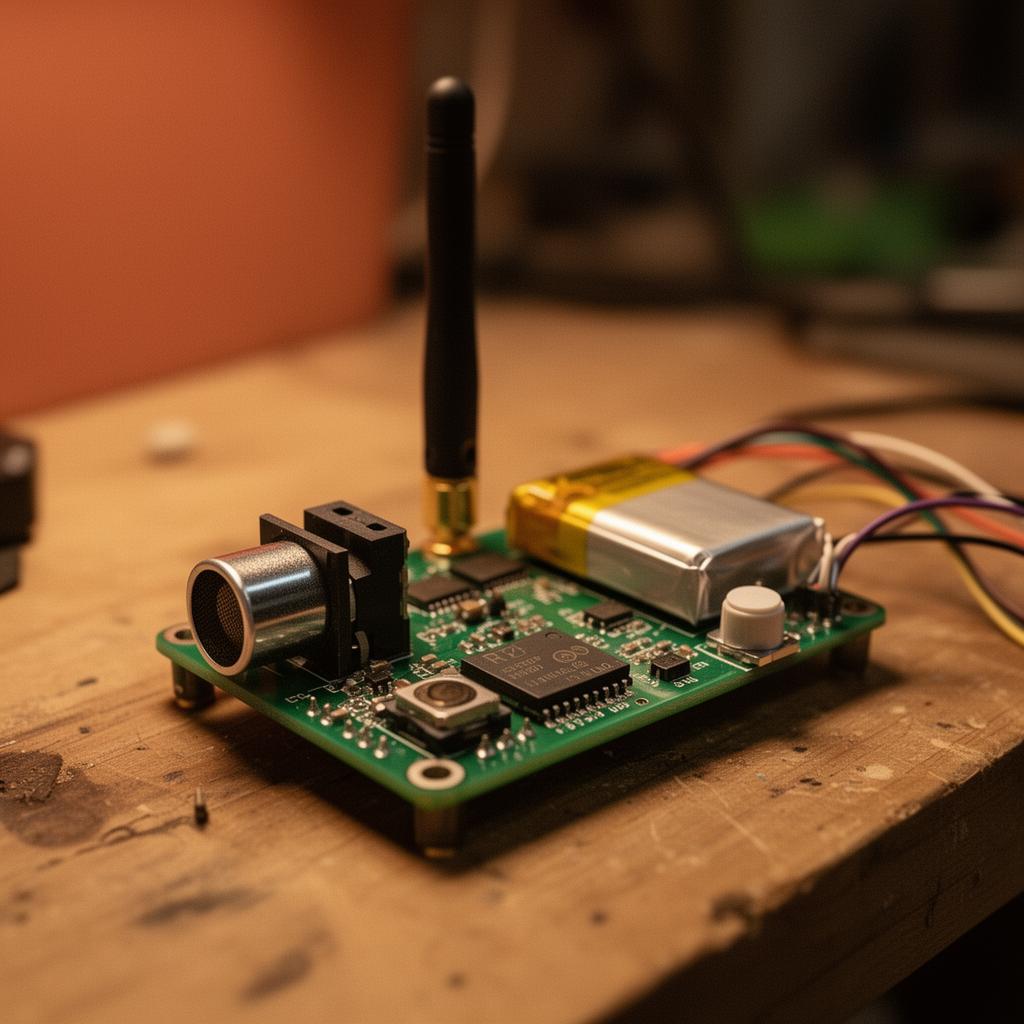
The node assumes the worst: weak signal, dropped power, no NTP. Each field is captured locally and buffered until the next successful uplink.
Impact
SDG 6 · SDG 13 · WASH · Climate Resilience
Team
01 · Team Lead
Owns ingestion, schemas, and reproducibility. Makes sure every score can be traced back to a row of source data.

02 · ML Dev & Frontend Dev
Builds SaniFlowCore scoring and the dispatch engine. Owns the path from raw telemetry to a deployable map.

03 · WASH Expert
Grounds the heuristic in real sanitation practice. Translates between district WASH officers and the model.

04 · IoT Engineer
Designs the in-pit telemetry node — level, power, RTC, WiFi/GSM. Hardware that runs where the network doesn't.
Partner with us
We're looking for district WASH partners, soil & hydrology datasets, and field-test sites for the IoT node.